Hyperoxaluria results from either inherited disorders of glyoxylate metabolism leading to hepatic oxalate overproduction (primary hyperoxaluria), or increased intestinal oxalate absorption (secondary hyperoxaluria). Hyperoxaluria may lead to urinary supersaturation of calcium oxalate and crystal formation, contributing to urolithiasis and deposition of calcium oxalate crystals in the kidney parenchyma, leading to oxalate nephropathy.
Establishment of oxalate diet induced oxalate nephropathy mouse model
Experimental animal: C57BL/6, 6-8 weeks old, male
Oxalate diet induced oxalate nephropathy
Fig.1 Serum urea nitrogen (UREA) and creatinine (CREA) were measured on Day 7,14 and 21. Values represent as means ± SEM, n=6, **P <0.01 and ***P <0.001 vs. Control group.
Fig.2 Representative pictures of HE, Masson, CD3, F4/80 and α-SMA staining showing increased crystal formation, inflammatory cell infiltration and interstitial fibrosis of Oxalate group. Scale bar: 100 μm.
5/6 nephrectomy produced high perfusion and filtration pressure to the remaining nephrons of mice. The residual nephrons were further destroyed, thus leading to chronic kidney disease characterized by sclerosis and hypertrophy of glomeruli.
Establishment of 5/6 nephrectomy-induced chronic kidney disease
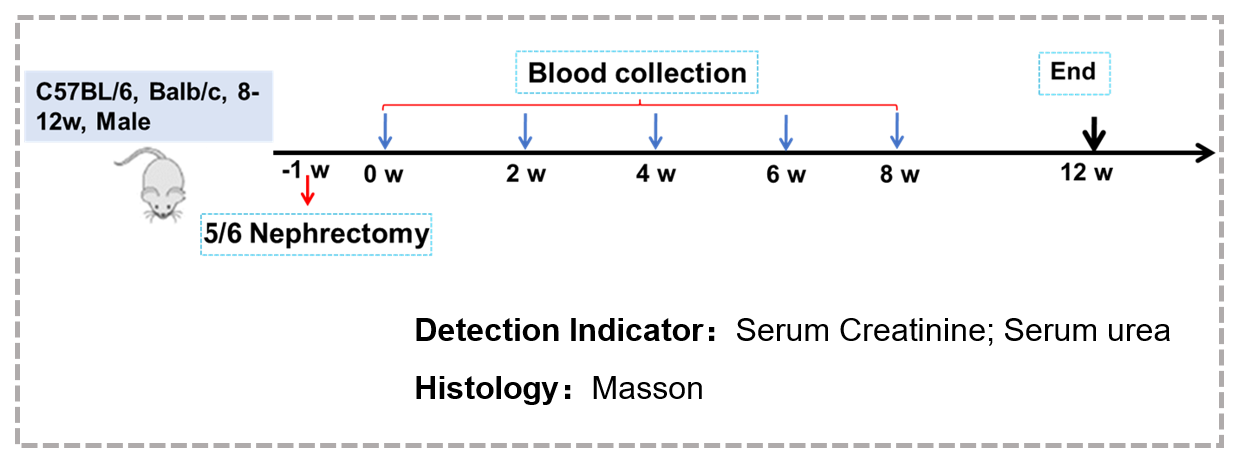
5/6 nephrectomy-induced chronic kidney disease in Balb/c mice
Fig.3 5/6 nephrectomy produced chronic kidney injury in mice. Mice received 5/6 nephrectomy or sham surgery 1 week before experiment. Blood was collected at week 5, 8 and 12. At the end of experiment, kidney tissues were collected for Masson staining. 5/6 nephrectomy produced a significant increase in creatinine (A) and urea (B) in serum. Pathology of Masson staining (C) showed that there were glomerular hypertrophy, sclerosis, and obvious fibrosis in the kidney of 5/6 Nephrectomy mice.
5/6 nephrectomy-induced chronic kidney disease in C57BL/6 mice
Fig.4 5/6 nephrectomy produced chronic kidney injury in mice. Mice received 5/6 nephrectomy or sham surgery 1 week before experiment. Blood was collected on week 0, 2, 4, 6 and 8. At the end of experiment, kidney tissues were collected for Masson staining. 5/6 nephrectomy produced an significant increase in creatinine (A) and urea (B) contention. Pathology of Masson staining (C) showed that there were glomerular hypertrophy, sclerosis, and obvious fibrosis in the kidney of 5/6 Nephrectomy mice.
Fig.1 Mouse model of diabetes nephropathy. (A) Body weight and random blood glucose levels. (B) Kidney weight and kidney to body weight ratio. (C) Total protein in urine and serum creatinine and serum urea nitrogen were measured at 10w and 15w. Values are means ±SEM from 5 mice/group. *p<0.05, **p<0.01, ***p<0.001.
Establishment of hyperuricemia mouse model by potassium oxyzinate and adenine
Fig.2 Establishment of hyperuricemia mouse model induced by PO and Adenine. (A) Serum uric acid were measured at days 28. (B) Serum uric acid levels measured at days 31. Values are means ±SEM from 6 mice/group. ****P <0.0001 vs. G2 group.
Fig.3 Establishment of uric acid nephropathy mouse model induced by PO and Adenine. (A) Representative pictures of HE staining show dilation, degeneration and regeneration of renal tubules, glomerular atrophy and renal interstitial inflammatory cell infiltration with fibroblast proliferation. Scale bar: 100 μm (B) Representative pictures of PAS staining show thickening of the Bowman capsule wall. Scale bar: 50 μm.(C-F) Statistic data of HE stainig. (G-H) Serum creatinine and urea nitrogen after induction.