Nonalcoholic fatty liver disease (NAFLD) is a disease in which fat accumulates excessively in the liver. This fat accumulation is not caused by heavy alcohol consumption. Non-alcoholic steatohepatitis (NASH) is one type of NAFLD. In addition to liver fat accumulation, there are pathological changes of hepatitis, hepatocyte injury, fibrosis and liver scar formation, which may lead to cirrhosis or liver cancer. The mechanism of NASH progression remains unclear, and effective treatments are still lacking.
The clinical symptoms of NASH are quite complex and include obesity, insulin resistance, steatohepatitis, hepatocyte ballooning, and fibrosis according to the disease process. NASH models often used in preclinical experiments are genetic animal models, diet-induced animal models, and animal models constructed by combining genetics with diet-inductioned. However, it is difficult to mimic all the pathogenetic features of human diseases in a short period of time.
To understand the pathogenic mechanisms underlying the development and progression of NASH and to develop innovative therapies, we developed several mouse models of different stages of NASH pathogenesis.
- Western diet (WD): Dietary components include high fructose and high cholesterol, and this diet-induced NASH model develops obesity, impaired glucose tolerance and hepatic steatosis.
- High-fat methionine-choline-deficient diet (HFMCD): The diet contains 60 kcal% fat, and is deficient in methionine and choline. , and this diet-induced NASH model shows increased liver injury, hepatic steatosis, and fibrosis accompanied by increased NAS scores.
- Carbon tetrachloride (CCl4) injection: causes significant liver inflammation and fibrosis. Because Although each the perfect model has is slightly different phenotypes,obtained, it is a good choice to select the appropriate model currently available according to the characteristics of the target.
Establishment of HFMCD (High Fat Methionine Choline Deficiency) -induced NASH Model

C57BL/6 male mice of 8 weeks were either fed a standard diet (STD) or a High-Fat Methionine-Choline-Deficient for 4 or 6 weeks.
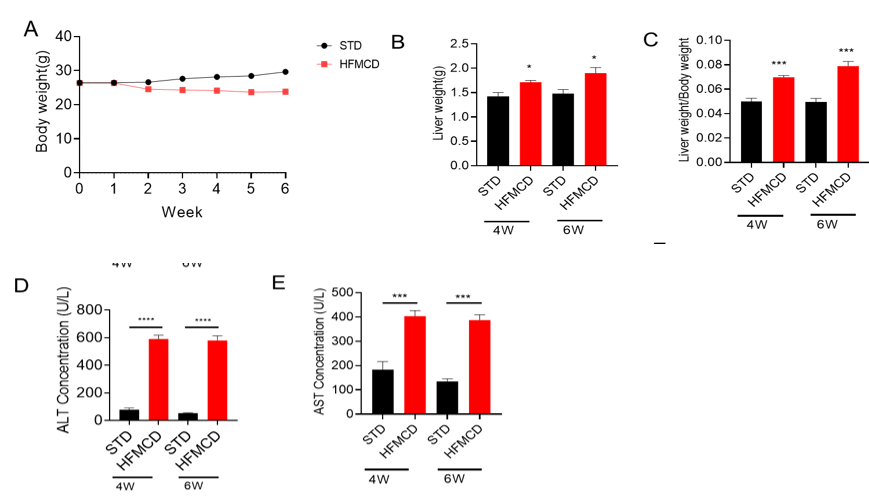
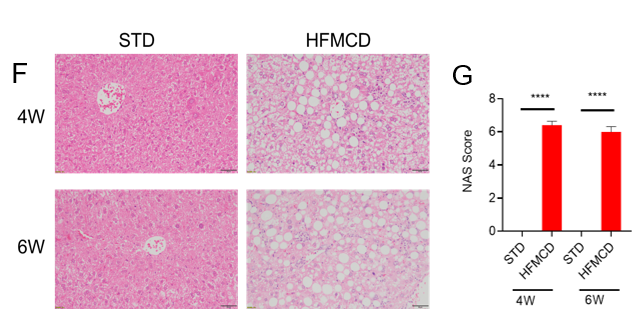
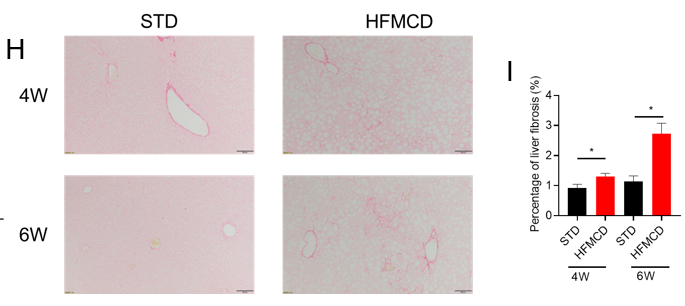
Analysis of H&E and Sirius red staining in the HFMCD-induced NASH mouse model. (A) Representative pictures of H&E staining showing increased hepatic steatosis and inflammation of HFMCD group . (B) The NAFLD activity score (NAS) was assessed by an external expert pathologist, revealing significantly increased NAS after HFMCD induction. Scale bar: 50 um. Values are expressed as mean ± SEM. *p<0.05, ****p<0.0001.
1. Gubra-Amylin diet-induced NASH model in aged mice

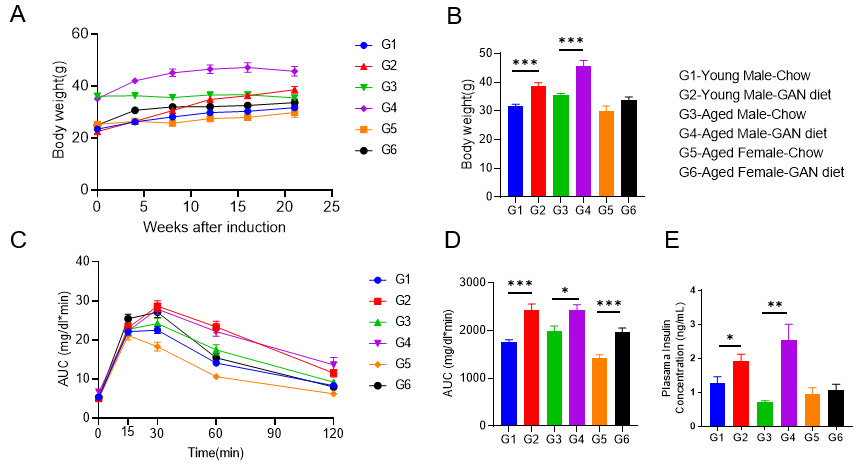
Gubra-Amylin diet-induced NASH model in aged mice. (A-B) Increased body weight of Gubra-Amylin diet induction group. (C) Impaired glucose tolerance ability induced by Gubra-Amylin diet. (D) Area under curve of C. (E)Increased plasma insulin content in Gubra-Amylin diet induction group. Data are means ±SEM. N=6-10 mice per group. *P <0.05, **P <0.01, ***P <0.001.
Aged mice exhibit a more severe NASH phenotype than younger mice after 12 weeks induction by Gubra-Amylin NASH diet
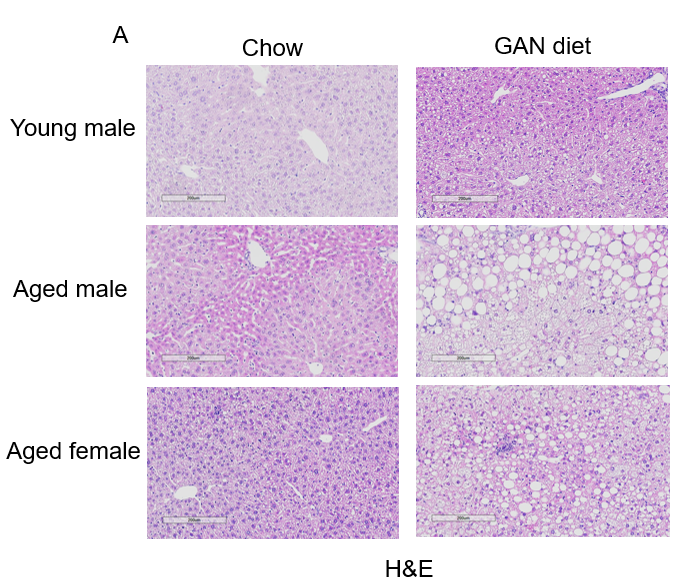
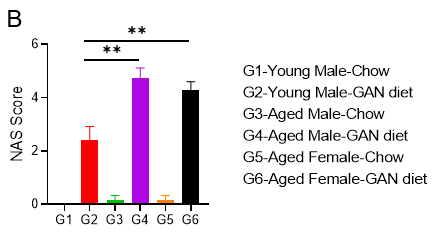
Gubra-Amylin diet-induced Nonalcoholic Steatohepatitis in aged mice. (A) Representative pictures of H&E staining after 12 weeks of induction. (B) NAFLD activity score (NAS) assessed by an external expert pathologist. N=6-10 mice per group. Data are expressed as mean ± SEM. **: p<0.01.
Aged mice exhibit a more severe fibrosis than younger mice after 21 weeks of induction by Gubra-Amylin NASH diet
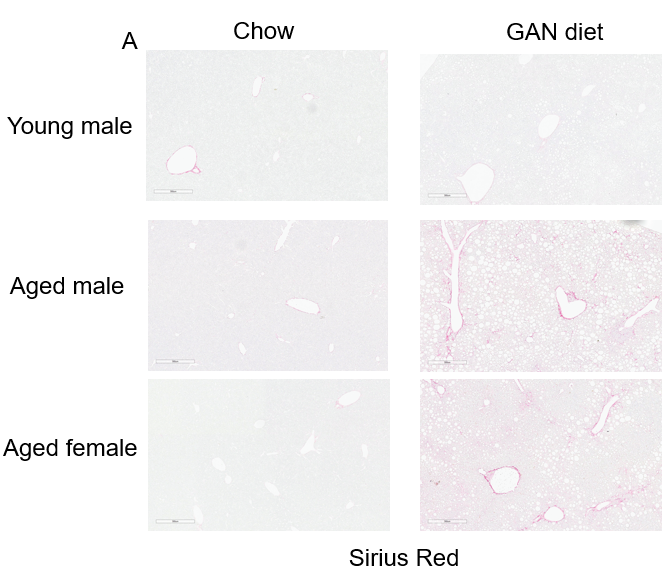
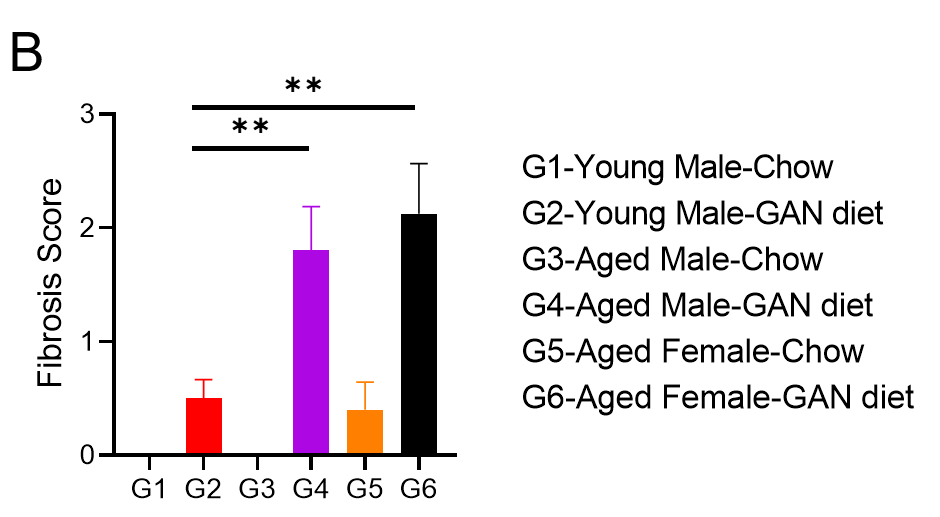
Gubra-Amylin diet-induced fibrosis in aged mice. (A) Representative pictures of Sirius red staining after 21 weeks of induction. (B) Fibrosis score of Sirius red staining. N=6-10 mice per group. Data are expressed as mean ± SEM. **: p<0.01.
Increased immune cell infiltration of liver in aged male mice after 21 weeks induction by Gubra-Amylin NASH diet
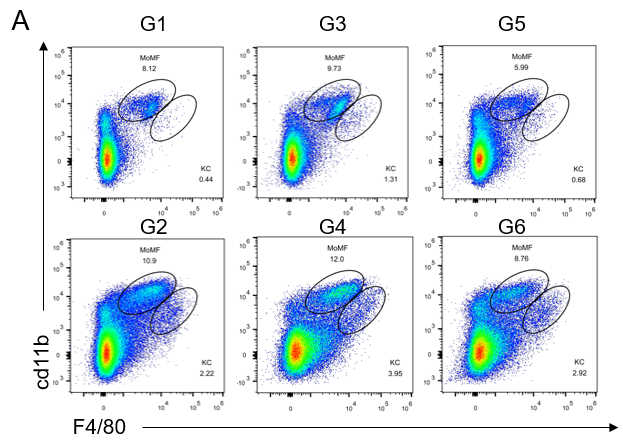
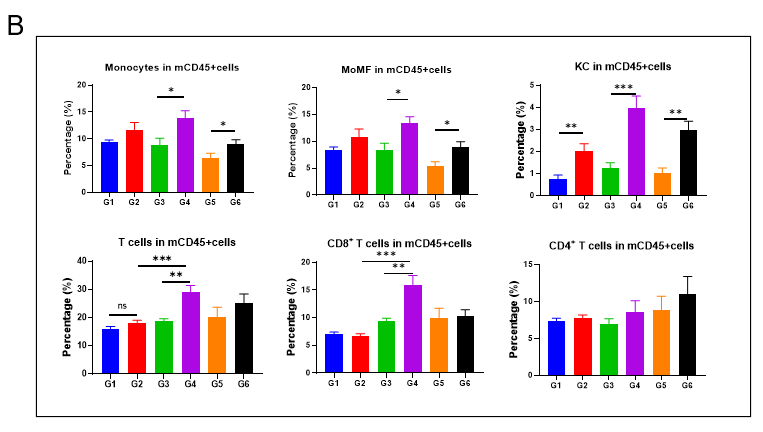
Increased immune cell infiltration of the liver in aged male mice after 21 weeks of induction by Gubra-Amylin NASH diet. (A) Percentage of infiltrating monocytes (CD11bintF4/80low) and Kupffer cells (CD11b+F4/80hi) in liver assessed by the flow cytometry. (B) Analysis of different types of immune cells in the liver. N=6-10 mice per group. Data are expressed as mean ± SEM. *P <0.05, **P <0.01, ***P <0.001.

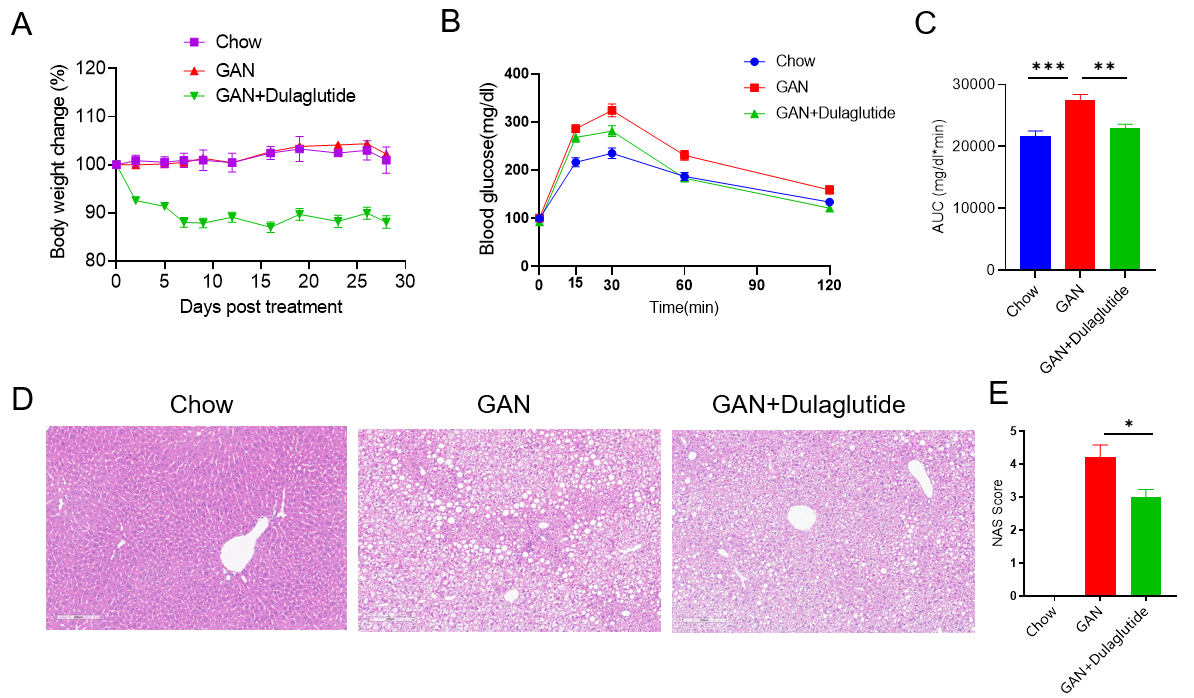
Gubra-Amylin diet-induced NASH model in C57BL/6 mice. (A) Body weight change under treatment. (B) Glucose tolerance ability after treatment. (C) Area under curve of B. (D) Representative pictures of H&E staining after 20 weeks of induction. (E) NAFLD activity score (NAS) assessed by an external expert pathologist. Data are expressed as mean ± SEM. N=9 mice per group. *p<0.05, **p<0.01,***p<0.001.
3. Gubra-Amylin diet-induced NASH model in B-ob/ob mice

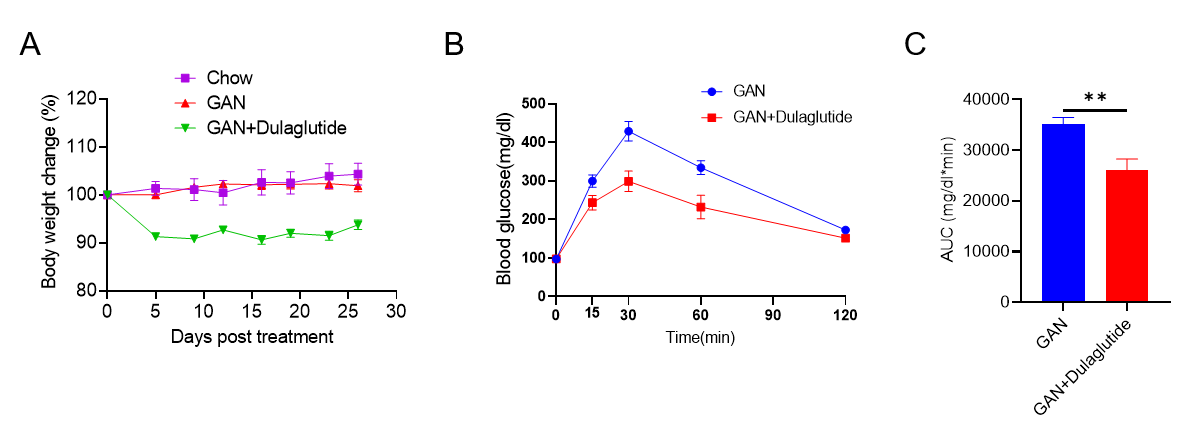
Gubra-Amylin diet-induced NASH model in B-ob/ob mice. (A) Body weight change under treatment. (B) Glucose tolerance ability after treatment. (C) Area under curve of B. Data are expressed as mean ± SEM. N=9 mice per group. *p<0.05, **p<0.01,***p<0.001.
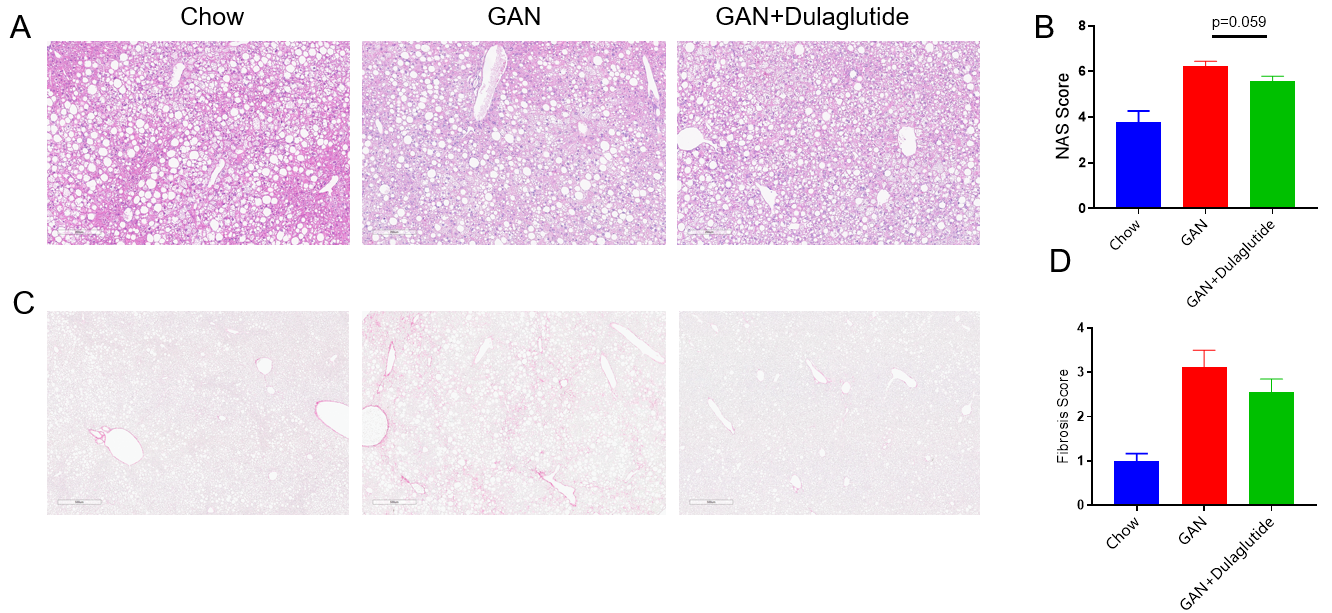
Gubra-Amylin diet induced Nonalcoholic Steatohepatitis and fibrosis in B-ob/ob mice. (A) Representative pictures of H&E staining after 16 weeks of induction. (B) NAFLD activity score (NAS) assessed by an external expert pathologist. (C) Representative pictures of Sirius red staining after 16 weeks of induction. (D) Fibrosis score of Sirius red staining. Data are expressed as mean ± SEM. N=9 mice per group.
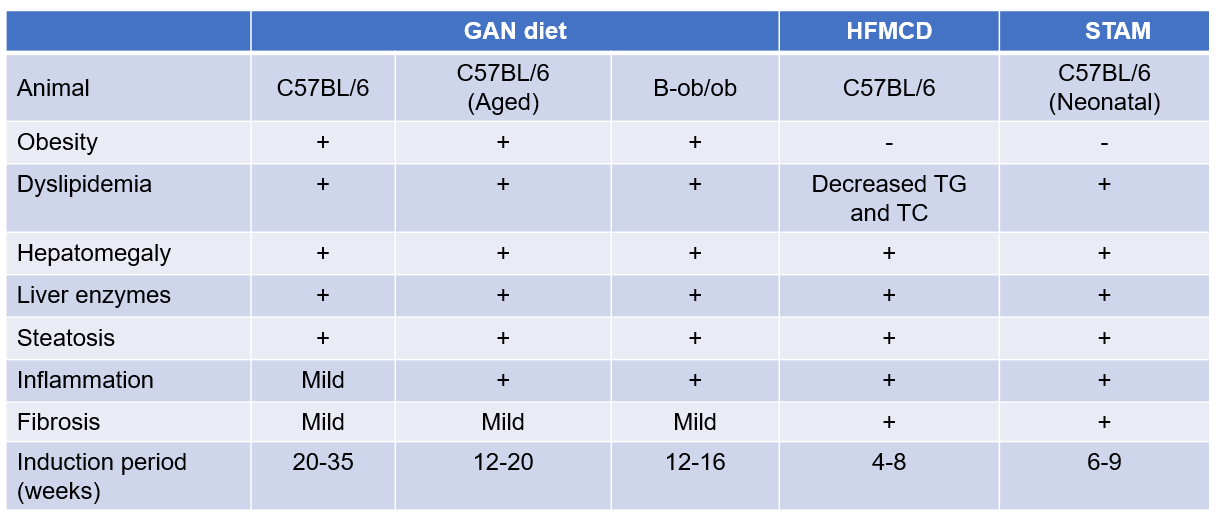
Summary of diet and chemical induced NASH models
References
1. Hansen, H.H., et al., Human translatability of the GAN diet-induced obese mouse model of non-alcoholic steatohepatitis. BMC Gastroenterol. 2020 Jul 6;20(1):210
2 .Hansen, H.H., et al., Mouse models of nonalcoholic steatohepatitis in preclinical drug development. Drug Discov Today, 2017. 22(11): p. 1707-1718.
3. Ibrahim, S.H., et al., Animal Models of Nonalcoholic Steatohepatitis: Eat, Delete, and Inflame. Dig Dis Sci, 2016. 61(5): p. 1325-36.
1. Hernandez-Perez, E., Leon Garcia, P.E., Lopez-Diazguerrero, N.E., Rivera-Cabrera, F. & Del Angel Benitez, E. Liver steatosis and nonalcoholic steatohepatitis: from pathogenesis to therapy. Medwave 16, e6535 (2016).
2. Tsuchida, T., et al. A simple diet- and chemical-induced murine NASH model with rapid progression of steatohepatitis, fibrosis and liver cancer. J Hepatol 69, 385-395 (2018).
3. Farrell, G., et al. Mouse Models of Nonalcoholic Steatohepatitis: Toward Optimization of Their Relevance to Human Nonalcoholic Steatohepatitis. Hepatology 69, 2241-2257 (2019).


 +86-10-56967680
 info@bbctg.com.cn